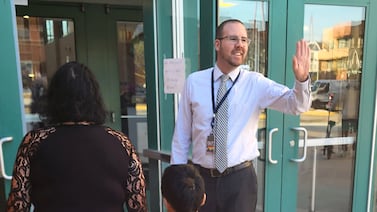
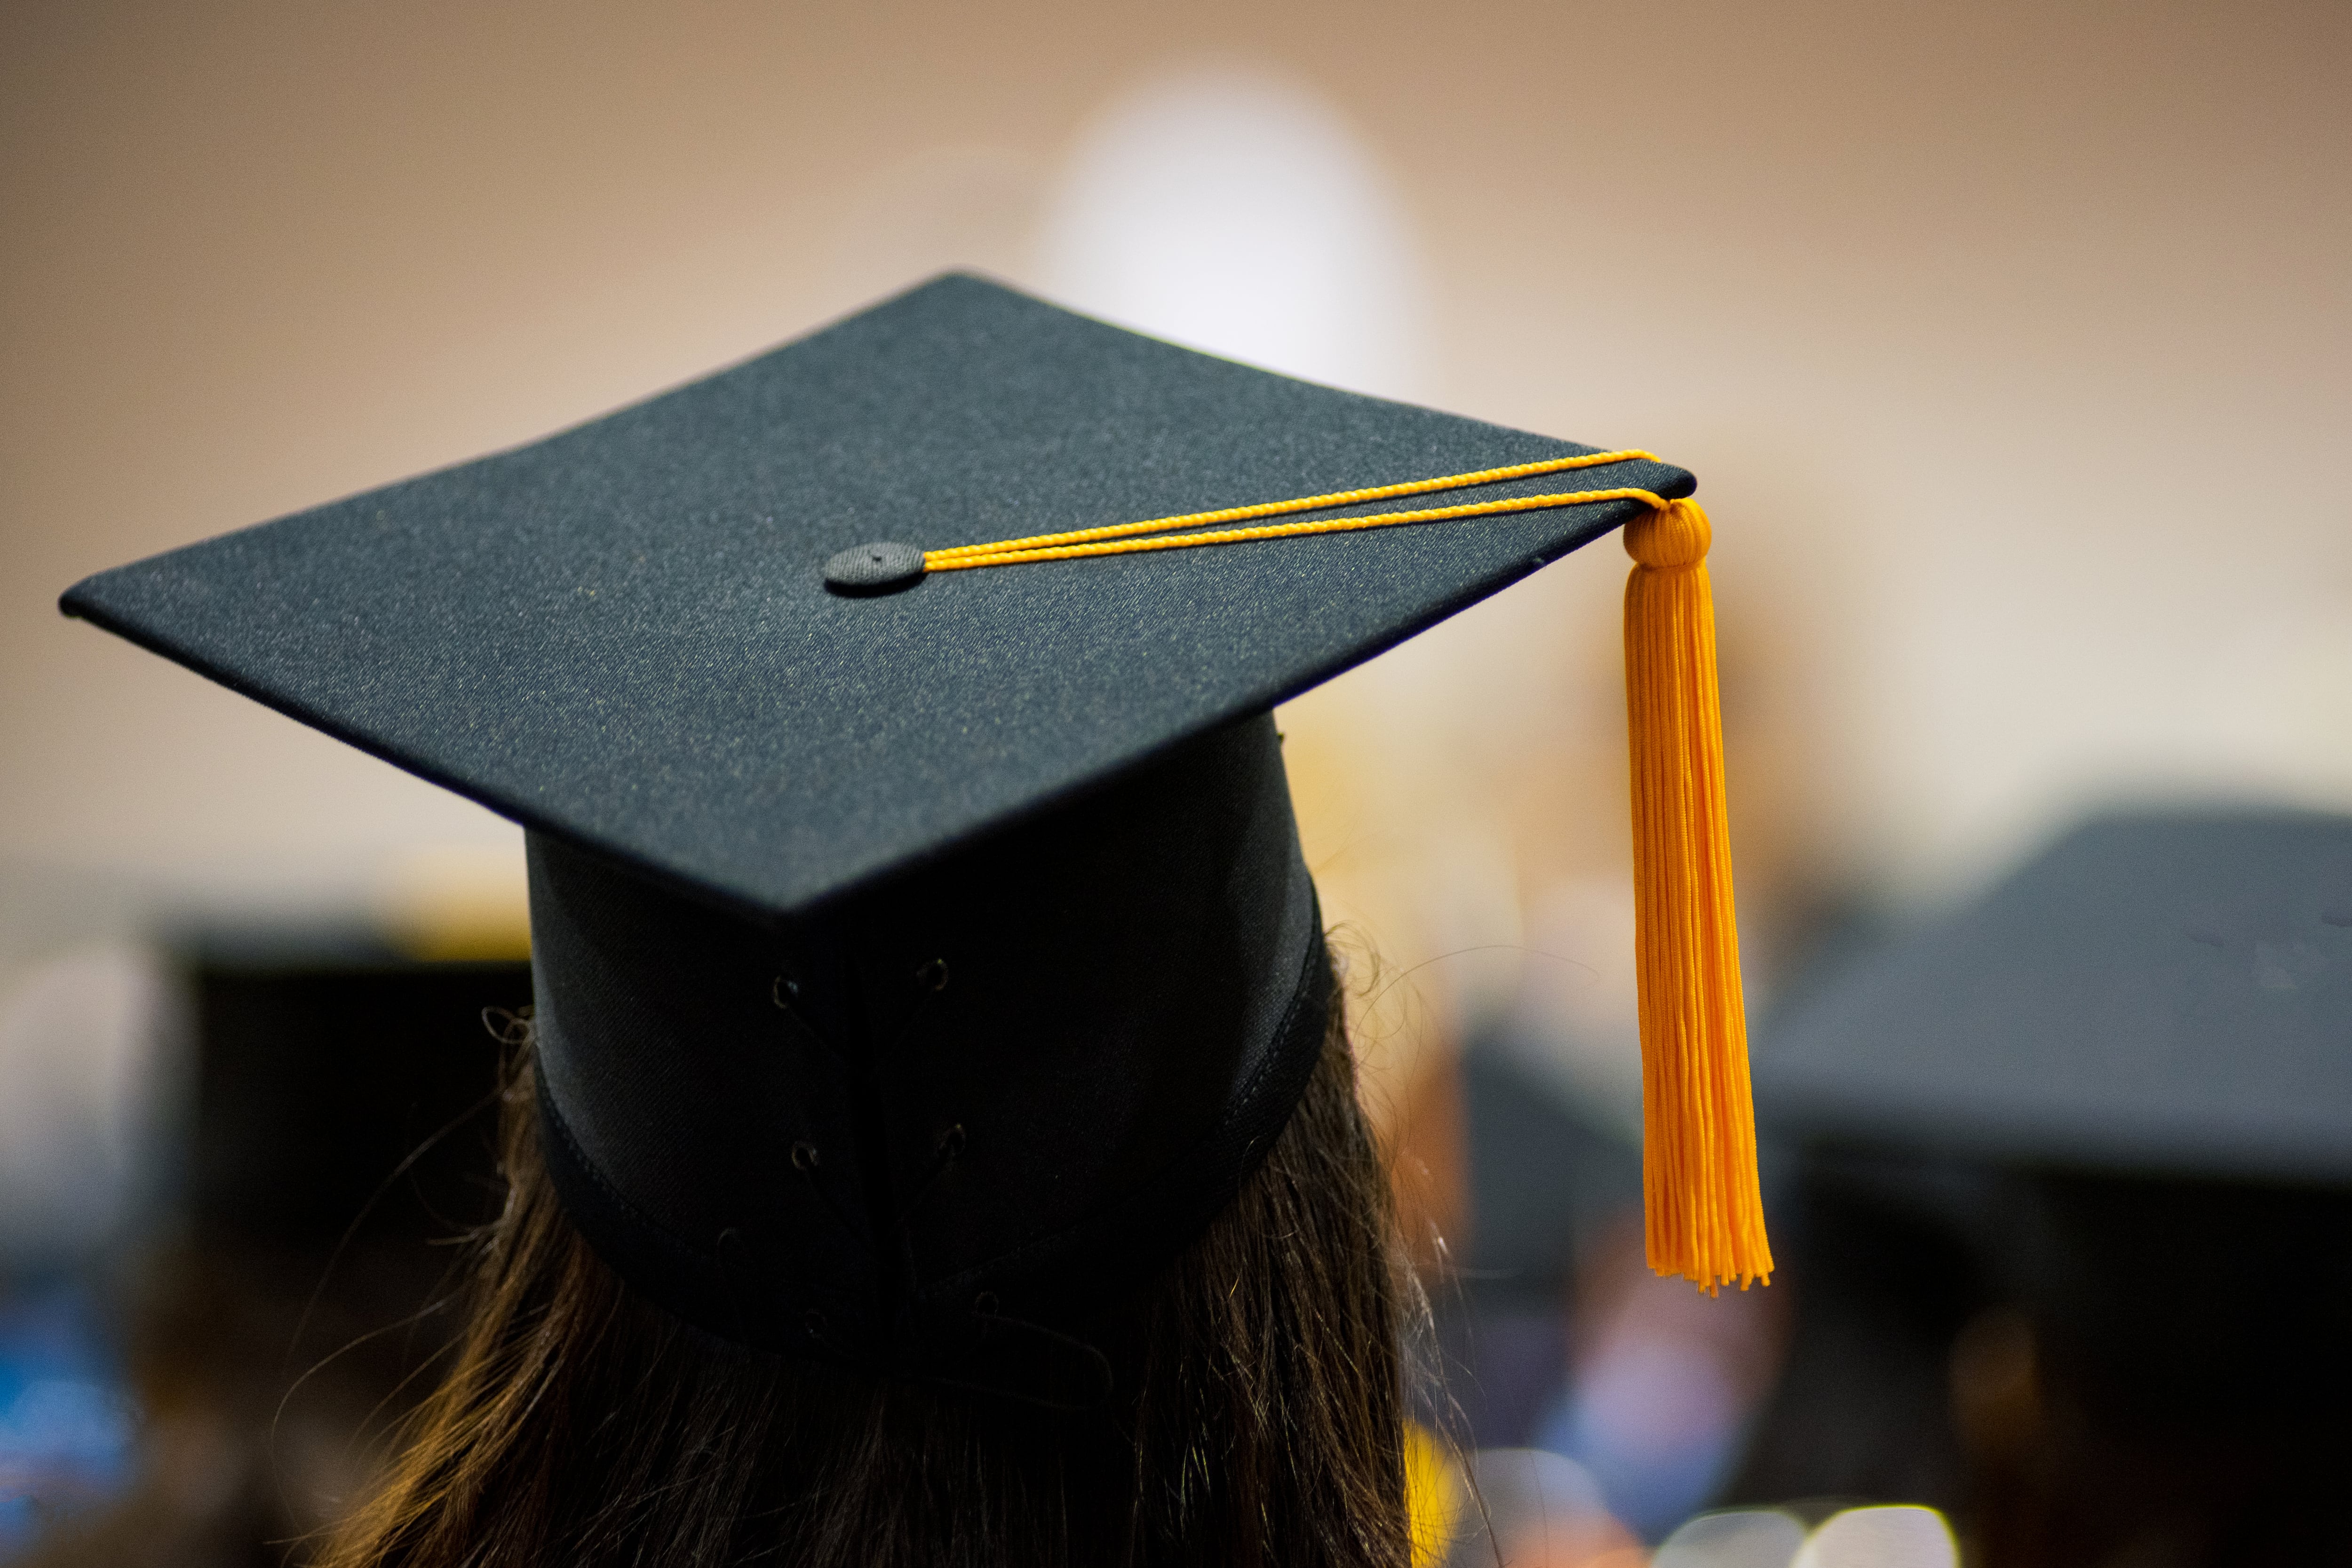
Chicago students graduated from high school at a record rate last spring amid the pandemic’s intense disruption to learning.
City officials said at a Friday press conference that 82.5% of students graduated in five years last spring, an uptick of almost 2 percentage points over last year. The increase was driven by growth in the percentage of Latino and Black students who finished school, though stark disparities in graduation rates remain. That includes a gap of 15 percentage points between the rates for Black students and their Asian peers. Asian students remained the group with the district’s highest graduation rate, even though that rate slipped slightly in recent years.
The district calculated rates using a new methodology that it said better accounted for freshmen who drop out and re-enroll later and for older students with disabilities who complete school at age 22.
In announcing the district’s 2019-2020 graduation rates, officials said the numbers showed resilience in the face of the coronavirus upheaval, which abruptly shifted learning online and challenged schools in unprecedented ways.
As for whether the growth also reflected efforts by educators and schools to give students grace as many struggled with the transition to remote learning — from paring down assignments to offering more time to complete school work — schools chief Janice Jackson said the graduation rates gains were “baked in” over students’ entire high school careers, before the pandemic hit.
Jackson said the news offers “the perfect note of optimism” to kick off the new school year next week.
“Instead of taking a step back, our students managed to take a leap forward,” said Mayor Lori Lightfoot, who credited Jackson’s leadership.“This is incredibly great news when you consider the challenges we all faced this past year, especially our students.”
The five-year graduation rate represents students who started high school five years ago and graduated this past spring or in most cases last year, before the pandemic. But the district also posted a record high four-year graduation rate, with more than 80% of students graduating on time in 2020.
Chicago’s five-year graduation rate first crested at 70% in 2016, and year-over-year growth has been a point of pride for city officials, with the rate nearing 80% last school year. In 2010, Chicago’s graduation rate hovered around 55%.
But not all racial groups are completing high school at the same rate — a point of concern for administrators.
In 2020, according to the new methodology, 84.5% of Latino students graduated, a 2.2 percentage-point increase over the previous year, and 78% of Black students graduated, an increase of 1.2 percentage points. Black students posted the highest increase of any racial group since 2017.
White students graduated at a rate of 89%, and Asian students at 92%.
Because of declining enrollment in the district, about 200 fewer students got diplomas last spring compared with 2019 despite the higher graduation rate, or a total 21,069 students.
District officials also noted the 2020 dropout rate was the lowest on record: 5.6%, a slight decrease from the previous year. But they stressed that the pandemic and resulting school closures made it challenging to track that rate because schools could not readily distinguish between students who dropped out and those who temporarily disengaged from virtual classes.
Designed in tandem with the University of Chicago’s Consortium on Chicago School Research, the district’s new methodology led it to announce revisions in previous years’ rates that raised the numbers by 1 to 2 percentage points across the past four years, with the district revising the 2018-2019 rates from 78.9% to 80.9%.
Chicago has previously come under scrutiny in years past for inflating its graduation numbers. Officials stressed their approach has remained “conservative” and relatively unchanged in recent years.
District data have historically shown that girls consistently finish high school at higher rates than boys, with Black girls, for instance, completing high school at a rate of almost 85% and Black boys finishing at a rate of 71%.
As in previous years, the individual schools reporting the highest rates tended to be the district’s selective enrollment schools. Of the 10 schools reporting the highest rates for last school year, seven are selective enrollment. That list includes Whitney Young, Northside College Prep, Walter Payton, Lane Tech, Jones College Prep, Hancock High School, Perspectives - Joslin High School, Back of the Yards, Westinghouse, and Williams High School.
The district waived some graduation requirements during the pandemic, such as its service learning requirement and expectation to take the SAT, which was not available last spring. But overall, officials said they stayed a course of holding students accountable, including a more stringent grading policy that some students and advocates criticized.
So Jackson dismissed the idea that more understanding educators and schools played a role in the graduation rate increase.
“These were anticipated results based on the totality of students’ high school experiences,” she said. “Those numbers are already baked.”
City leaders vowed to maintain the academic momentum into what is shaping up to be a challenging school year, which begins virtually for all district students.
“Even in the midst of a public health emergency, we’ll do our best to make sure Chicago students have access to high-quality education,” Jackson said. “We are not taking our foot off the gas.”
School Name | Graduation rate | Percentage point change | Number of graduates |
---|---|---|---|
Whitney M Young Magnet High School | 98.1% | -0.7% | 408 |
Northside College Preparatory High School | 97.5% | -1.3% | 268 |
Walter Payton College Preparatory High School | 97.3% | +0.4% | 217 |
Albert G Lane Technical High School | 96.9% | +0.2% | 1,074 |
William Jones College Preparatory High School | 96.7% | +0.4% | 404 |
Ray Graham Training Center High School | 96.4% | +9.5% | 188 |
Perspectives - Rodney D. Joslin | 96.2% | +0.6% | 51 |
Back of the Yards IB HS | 96.0% | -1.3% | 240 |
George Westinghouse College Prep | 95.8% | +0.7% | 272 |
Daniel Hale Williams Prep School of Medicine | 95.3% | +2.9% | 61 |
Kenwood Academy High School | 95.0% | +1.7% | 321 |
Acero Charter Schools - Major Hector P. Garcia MD | 95.0% | +8.4% | 152 |
Dr Martin Luther King Jr College Prep HS | 94.8% | -2.1% | 145 |
Infinity Math Science and Technology High School | 94.7% | +1.2% | 108 |
Noble - Pritzker College Prep | 94.2% | +5.1% | 243 |
Gwendolyn Brooks College Preparatory Academy HS | 94.1% | +1.1% | 208 |
Ogden International High School | 94.0% | -0.4% | 79 |
Noble - UIC College Prep | 93.7% | +2.7% | 207 |
Noble - Rauner College Prep | 93.6% | +4.1% | 160 |
George Washington Carver Military Academy HS | 93.4% | -2.8% | 99 |
Noble - Noble College Prep | 93.4% | +2.0% | 156 |
Chicago Math and Science Academy Charter School | 93.4% | +8.0% | 71 |
Marine Leadership Academy at Ames | 93.2% | +2.8% | 179 |
Charles Allen Prosser Career Academy High School | 93.0% | +2.3% | 317 |
Friedrich W von Steuben Metropolitan Science HS | 92.9% | +1.4% | 395 |
University of Chicago - Woodlawn | 92.9% | +14.0% | 105 |
Hyman G Rickover Naval Academy High School | 92.8% | +4.2% | 128 |
Noble - Muchin College Prep | 92.3% | -1.5% | 229 |
CICS - Northtown | 92.1% | 199 | |
Sarah E. Goode STEM Academy | 92.0% | -0.3% | 206 |
Robert Lindblom Math & Science Academy HS | 91.8% | -4.0% | 269 |
Noble - Chicago Bulls College Prep | 91.2% | +3.0% | 291 |
Perspectives - Math and Science Academy | 91.2% | +9.1% | 104 |
Disney II Magnet High School | 91.0% | +9.5% | 101 |
Greater Lawndale High School For Social Justice | 90.7% | +3.9% | 78 |
Phoenix Military Academy High School | 90.3% | -5.5% | 139 |
Richard T Crane Medical Preparatory HS | 90.3% | +1.1% | 139 |
South Shore Intl College Prep High School | 90.0% | -4.4% | 135 |
Intrinsic Charter School | 89.9% | +2.7% | 151 |
Acero Charter Schools - Sor Juana Inés de la Cruz | 89.6% | +9.6% | 43 |
Catalyst - Maria Charter School | 89.1% | +11.1% | 122 |
Noble - Gary Comer College Prep | 88.9% | +3.6% | 193 |
Eric Solorio Academy High School | 88.8% | -1.4% | 237 |
Chicago High School for Agricultural Sciences | 88.5% | +3.4% | 154 |
Neal F Simeon Career Academy High School | 88.4% | -1.2% | 245 |
William Howard Taft High School | 88.4% | +4.5% | 571 |
Roald Amundsen High School | 88.3% | +4.5% | 263 |
Lake View High School | 87.7% | +1.1% | 272 |
Bronzeville Scholastic Academy High School | 87.4% | +1.6% | 90 |
Chicago Military Academy High School | 87.0% | -3.6% | 47 |
Chicago High School for the Arts (ChiArts) | 87.0% | +1.3% | 127 |
Noble - Golder College Prep | 86.8% | +1.1% | 145 |
George Washington High School | 86.5% | +6.1% | 288 |
Noble - ITW David Speer Academy | 86.2% | +0.7% | 337 |
Gurdon S Hubbard High School | 86.2% | +2.6% | 392 |
Lincoln Park High School | 85.6% | -4.0% | 369 |
Michele Clark Academic Prep Magnet High School | 85.6% | +1.8% | 113 |
Morgan Park High School | 85.6% | +7.1% | 286 |
Instituto Health Sciences Career Academy | 85.3% | -2.0% | 157 |
Chicago Academy High School | 85.1% | -0.1% | 120 |
Noble - John and Eunice Johnson College Prep | 84.7% | +12.9% | 232 |
CICS - ChicagoQuest North | 84.6% | +4.0% | 33 |
Roberto Clemente Community Academy High School | 84.5% | +1.8% | 180 |
Noble - The Noble Academy | 84.0% | +4.2% | 84 |
Noble - Butler College Prep | 84.0% | +4.4% | 158 |
EPIC Academy Charter High School | 83.7% | +4.3% | 118 |
Horizon Science Academy Southwest Chicago Charter | 83.7% | 41 | |
Multicultural Academy of Scholarship | 83.6% | +3.6% | 51 |
ASPIRA Charter School - Mirta Ramirez | 83.3% | +18.8% | 10 |
Nicholas Senn High School | 83.2% | +1.2% | 253 |
North-Grand High School | 82.9% | +2.3% | 209 |
Urban Prep Academy for Young Men - Bronzeville | 82.6% | +8.9% | 76 |
Acero Charter Schools - Victoria Soto | 82.6% | +9.6% | 157 |
Stephen T Mather High School | 82.5% | +3.4% | 298 |
ASPIRA Business and Finance | 81.8% | 121 | |
CICS - Longwood | 81.3% | -4.1% | 74 |
John F Kennedy High School | 80.7% | +1.5% | 335 |
Noble - DRW College Prep | 80.3% | +11.1% | 167 |
Noble - Hansberry College Prep | 80.2% | -6.4% | 166 |
North Lawndale College Prep - Christiana | 80.2% | +8.9% | 81 |
Percy L Julian High School | 79.9% | +3.2% | 119 |
Louisa May Alcott College Preparatory HS | 79.8% | -12.3% | 71 |
Chicago Vocational Career Academy High School | 79.7% | +5.7% | 165 |
Air Force Academy High School | 79.6% | -4.8% | 74 |
William J Bogan High School | 79.2% | +1.1% | 141 |
Perspectives - Leadership Academy | 79.2% | +2.2% | 84 |
CICS - Ralph Ellison | 79.1% | -0.9% | 91 |
Perspectives - High School of Technology | 79.1% | +1.1% | 72 |
Chicago Technology Academy High School | 78.9% | -10.0% | 45 |
Marie Sklodowska Curie Metropolitan High School | 78.5% | -0.3% | 578 |
Legal Prep Charter Academy | 78.1% | +6.3% | 50 |
Benito Juarez Community Academy High School | 78.0% | -4.4% | 369 |
Noble - Baker College Prep | 77.8% | -3.4% | 119 |
Urban Prep Academy for Young Men - Englewood | 77.1% | -3.1% | 74 |
World Language Academy High School | 77.0% | -7.3% | 57 |
Spry Community Links High School | 76.9% | +3.2% | 30 |
Al Raby High School | 76.5% | +1.7% | 88 |
Hyde Park Academy High School | 76.4% | -0.7% | 155 |
Austin Polytechnical Academy High School | 76.2% | +15.6% | 16 |
Theodore Roosevelt High School | 75.4% | +6.0% | 169 |
John Marshall Metropolitan High School | 73.8% | +5.9% | 62 |
North Lawndale College Prep - Collins | 73.7% | +0.3% | 84 |
Edwin G. Foreman College and Career Academy | 73.7% | +7.6% | 126 |
Young Women's Leadership Charter School | 73.4% | -5.2% | 80 |
ASPIRA Charter School - Early College High School | 73.1% | +2.6% | 68 |
Charles P Steinmetz College Preparatory HS | 73.0% | -0.8% | 189 |
Noble - Rowe-Clark Math and Science Academy | 72.9% | -6.0% | 97 |
Thomas Kelly College Preparatory | 72.4% | +4.1% | 437 |
Wells Community Academy High School | 71.4% | -2.9% | 40 |
David G Farragut Career Academy High School | 71.1% | +3.3% | 143 |
Carl Schurz High School | 71.0% | +0.7% | 252 |
Uplift Community High School | 69.9% | -17.4% | 58 |
Frederick A Douglass Academy High School | 69.7% | +5.4% | 23 |
George H Corliss High School | 68.6% | +0.9% | 59 |
Paul Laurence Dunbar Career Academy High School | 68.0% | -0.2% | 100 |
Gage Park High School | 66.7% | -4.2% | 56 |
Emil G Hirsch Metropolitan High School | 66.7% | +14.4% | 20 |
Wendell Phillips Academy High School | 66.7% | +2.9% | 98 |
Bowen High School | 63.6% | +0.7% | 49 |
Roger C Sullivan High School | 63.4% | -7.9% | 104 |
Urban Prep Academy for Young Men, West Campus | 62.9% | -10.4% | 56 |
Collins Academy High School | 62.9% | +2.4% | 39 |
Ellen H Richards Career Academy High School | 61.7% | -5.0% | 50 |
Marine Leadership Academy | 60.0% | +6.4% | 24 |
Edward Tilden Career Community Academy HS | 59.7% | -0.9% | 40 |
Austin College and Career Academy High School | 58.8% | -1.8% | 10 |
Chicago Virtual Charter School | 58.8% | -7.9% | 20 |
Kelvyn Park High School | 58.2% | -4.0% | 46 |
William Rainey Harper High School | 57.6% | -12.4% | 34 |
John M Harlan Community Academy High School | 55.7% | -6.7% | 64 |
Chicago Talent Development High School | 55.2% | -7.0% | 16 |
Christian Fenger Academy High School | 53.1% | -17.3% | 26 |
Manley Career Academy High School | 52.5% | +4.7% | 21 |
Hope College Preparatory High School | 51.2% | -16.3% | 22 |
Dusable Leadership Academy | 48.5% | -18.2% | 16 |
Orr Academy High School | 46.7% | +12.1% | 43 |
ACE Technical Charter High School | 28.1% | -43.9% | 27 |
ACE Amandla Charter High School | 22.2% | -17.2% | 6 |
Northside Learning Center High School | 6.7% | +6.7% | 1 |